使用 Python 从视频片段中确定足球球员球衣的颜色
使用 K-Means 聚类来识别球员球衣颜色足球是世界上最受欢迎的运动。在洪都拉斯,足球能够吸引大众的注意力,并在 90 分钟内让人群陷入情绪的漩涡。多年来,我们看到各种技术被实施,以获取有关比赛内事件和球员表现的各种统计数据和信息
使用 K-Means 聚类来识别球员球衣颜色
足球是世界上最受欢迎的运动。在洪都拉斯,足球能够吸引大众的注意力,并在 90 分钟内让人群陷入情绪的漩涡。
多年来,我们看到各种技术被实施,以获取有关比赛内事件和球员表现的各种统计数据和信息。
通常,不仅为足球,而且为许多其他运动开发/实施的最有趣的技术应用程序之一是计算机视觉。计算机视觉 (CV) 是有关开发能够理解图像或视频等视觉数据的算法和/或人工智能的领域。CV 非常强大,在 Instagram 过滤器、自动驾驶汽车、MRI 重建、癌症检测等许多应用中都很常见。
在这个项目中,我们在不同的足球比赛中拍摄了一系列视频片段,并使用 K-Means 聚类算法确定了球员球衣颜色的颜色。
本文将详细介绍实现该目标的过程。这里开发的例程将视频片段作为输入,并生成一个包含聚类过程结果的 pandas 数据帧作为输出。
这个项目需要执行数据清理、聚类、图像/视频处理、图像中对象的基本分类、读取 JSON 文件以及各种 pandas/numpy 数组/列表操作。
本文目录:
· 图像处理基础
· 从图像中提取颜色
· 从视频文件中提取帧
· 从JSON文件中提取播放器边界框
· 实现K-Means聚类确定球员球衣颜色
· 制作用于快速可视化聚类结果的GUI
· 结论
让我们开始吧!
图像/视频处理基础
本节将介绍对本项目很重要的图像和视频处理/操作的基础知识。
使用足球历史上我最喜欢的时刻之一作为参考图像来尝试各种可用的处理技术。那一刻是罗纳尔迪尼奥在 2005 年 11 月 19 日效力于巴塞罗那足球俱乐部时,对阵皇家马德里的精彩进球,如下图所示。

2005 年 11 月 19 日,罗纳尔迪尼奥对皇家马德里的进球。
使用 OpenCV 加载图像
需要做的第一件事是将图像加载到笔记本中。如果你将图像保存在计算机上,则可以简单地使用cv2.imread函数。但是,对于在这部分工作中使用的图像,是通过 URL 获取的。然后,加载图像需要我们:
1. 将我们的 URL 传入urllib.request.urlopen
2. 从 URL 中的图像创建一个 numpy 数组
3. cv2.imdecode用于从内存缓存中读取图像数据,并将其转换为图像格式。
4. 由于cv2.imdecode默认以 BGR 格式加载图像,因此我将使用cv2.cvtColor(img, cv2.COLOR_BGR2RGB)原始 RGB 处理和渲染图像。
#Render image from URL
req = urllib.request.urlopen('https://www.sportbible.com/cdn-cgi/image/width=648,quality=70,format=webp,fit=pad,dpr=1/https%3A%2F%2Fs3-images.sportbible.com%2Fs3%2Fcontent%2Fcf2701795dd2a49b4d404d9fa38f99fd.jpg')
arr = np.asarray(bytearray(req.read()), dtype=np.uint8)
bgr_img = cv2.imdecode(arr, -1) # 'Load it as it is'
# Determine the figures size in inches to fit image
dpi = plt.rcParams['figure.dpi']
height, width, depth = bgr_img.shape
figsize = width / float(dpi), height / float(dpi)
plt.figure(figsize=figsize)
plt.imshow(bgr_img)
plt.show()
此过程的结果如下所示:
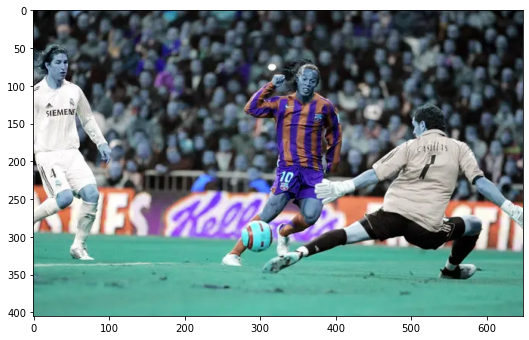
使用 OpenCV 在 BGR 空间中加载的图像。
如你所见,加载的此图像中的颜色与原始图像中看到的颜色不匹配。这是因为 OpenCV 在 BGR 颜色空间中默认加载的图像。
不过问题不大,因为切换到 RGB 颜色空间可以通过快速的代码行来完成,如下所示:
#Convert image to RGB from BGR
rgb_img = cv2.cvtColor(bgr_img, cv2.COLOR_BGR2RGB)
plt.figure(figsize=figsize)
plt.imshow(rgb_img)
plt.show()

使用 OpenCV 在 BGR 空间中加载的图像。
现在可以开始使用各种图像处理/操作技术了。将在这里展示其中的一些!
旋转图像
有几种不同的方法可以旋转图像。imutils 包通过imutils.rotate_bound函数具有最简单的实现,因为它所需要的只是要旋转的图像,以及我们要旋转图像的角度。
除此之外,此功能确保显示的旋转图像不会被裁剪并完全包含在边界内。其他方法需要首先构建旋转矩阵,然后应用旋转矩阵。
#Rotating an image
rotated0 = imutils.rotate_bound(rgb_img,0)
rotated45 = imutils.rotate_bound(rgb_img,45)
rotated90 = imutils.rotate_bound(rgb_img,90)
fig,axs = plt.subplots(1,3, figsize=(30,15))
axs[0].imshow(rotated0)
axs[1].imshow(rotated45)
axs[2].imshow(rotated90)
plt.show()
此操作的结果如下所示:

在 Python 中旋转图像。
裁剪图像
通过 OpenCV 加载图像时,图像被加载为 numpy 数组。然后,要裁剪图像,我们可以简单地使用 numpy 切片来裁剪内容。
我们有多种裁剪的方法。将在这里展示一个简单的示例,我们可以按不同的高度和宽度百分比裁剪图像。通过定义感兴趣区域 (ROI) 和轮廓,将在后面的部分中展示更多的方法来裁剪。
#Need to find the starting/ending column and row index first for the desired cropping
cropIni = [0.15,0.3,0.45]
#Crop width and height of image by 15% each
startRow1 = int(height*cropIni[0]) ;startCol1 = int(width*cropIni[0])
endRow1 = int(height*(1-cropIni[0])) ;endCol1 = int(width*(1-cropIni[0]))
#Crop width and height of image by 30% each
startRow2= int(height*cropIni[1]) ;startCol2 = int(width*cropIni[1])
endRow2 = int(height*(1-cropIni[1])) ;endCol2 = int(width*(1-cropIni[1]))
#Crop width and height of image by 40% each
startRow3 = int(height*cropIni[2]) ;startCol3 = int(width*cropIni[2])
endRow3 = int(height*(1-cropIni[2])) ;endCol3 = int(width*(1-cropIni[2]))
#This is just slicing the array
fig,axs = plt.subplots(1,3, figsize=(30,15))
crop1 = rgb_img[startRow1:endRow1, startCol1:endCol1]
crop2 = rgb_img[startRow2:endRow2, startCol2:endCol2]
crop3 = rgb_img[startRow3:endRow3, startCol3:endCol3]
axs[0].imshow(crop1)
axs[1].imshow(crop2)
axs[2].imshow(crop3)
plt.show()

通过 Python 中的 numpy 切片裁剪图像。
调整图像大小
调整图像大小的方法有很多。在这里,将展示如何使用 OpenCV 中的 resize 函数调整图像大小。尽管图像看起来相同,但可以看出,当我们调整图像大小时,图像的大小(高度和宽度)会发生变化。
#Resizing an image
#cv2.resize(src, dsize[, dst[, fx[, fy[, interpolation]]]])
xscale = [0.75,0.5,0.25]
yscale = [0.75,0.5,0.25]
rimg1 = cv2.resize(rgb_img, (0,0), fx=xscale[0], fy=yscale[0])
rimg2 = cv2.resize(rgb_img, (0,0), fx=xscale[1], fy=yscale[1])
rimg3 = cv2.resize(rgb_img, (0,0), fx=xscale[2], fy=yscale[2])
fig,axs = plt.subplots(1,3, figsize=(30,15))
axs[0].imshow(rimg1)
axs[1].imshow(rimg2)
axs[2].imshow(rimg3)
plt.show()
print("The width, height and depth of this image are ",rimg1.shape)
print("The width, height and depth of this image are ",rimg2.shape)
print("The width, height and depth of this image are ",rimg3.shape)

在 Python 中调整图像大小。
The width, height and depth of this image are (304, 486, 3)
The width, height and depth of this image are (202, 324, 3)
The width, height and depth of this image are (101, 162, 3)
调整图像的亮度/对比度
可以通过OpenCV 中的addWeighted功能来调整图像的亮度/对比度。这是一个称为混合的过程。此函数使用以下转换对图像进行这些调整:
result = αsrc1 + βsrc2 + γ
在上面的等式中,通过将α值应用于源图像、将β值应用于其他图像(它可以是相同的源图像)并将其值增加来修改混合图像γ。
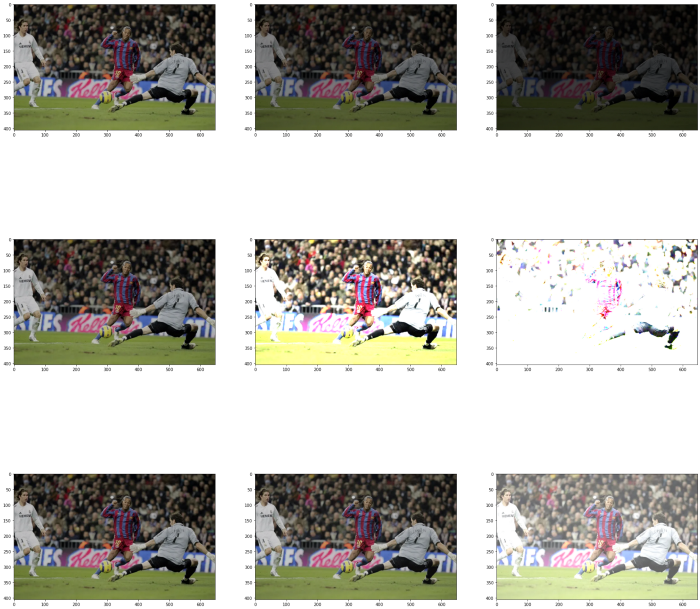
混合效果如下图所示。
第一行图显示了α在保持其他两个参数不变的情况下变化的效果(α从左到右递减)。
第二行图显示了β在保持其他两个参数不变的情况下变化的效果(β从左到右增加)。
第三行图显示了γ在保持其他两个参数不变的情况下变化的效果(γ从左到右增加)。
· 减小α使图像变暗。
· 增加β使图像具有更强的对比度。
· 减小γ使图像柔化。
#cv2.addWeighted(source_img1, alpha, source_img2, beta, gamma)
alpha = [0.75, 0.5, 0.25]
beta = [0, 1 , 10]
gamma = [0, 10 ,100]
#Vary alpha
alpha_img1 = cv2.addWeighted(rgb_img, alpha[0], rgb_img, beta[0], gamma[0])
alpha_img2 = cv2.addWeighted(rgb_img, alpha[1], rgb_img, beta[0], gamma[0])
alpha_img3 = cv2.addWeighted(rgb_img, alpha[2], rgb_img, beta[0], gamma[0])
#Vary beta
beta_img1 = cv2.addWeighted(rgb_img, alpha[0], rgb_img, beta[0], gamma[0])
beta_img2 = cv2.addWeighted(rgb_img, alpha[0], rgb_img, beta[1], gamma[0])
beta_img3 = cv2.addWeighted(rgb_img, alpha[0], rgb_img, beta[2], gamma[0])
#Vary gamma
gamma_img1 = cv2.addWeighted(rgb_img, alpha[0], rgb_img, beta[0], gamma[0])
gamma_img2 = cv2.addWeighted(rgb_img, alpha[0], rgb_img, beta[0], gamma[1])
gamma_img3 = cv2.addWeighted(rgb_img, alpha[0], rgb_img, beta[0], gamma[2])
在 Python 中更改图像的亮度和对比度。
更改图像的色彩空间
图像处理中使用了多种颜色空间,可以促进各种任务,例如边缘检测、颜色检测和应用蒙版等等。
使用 OpenCV 通过cvtColor函数可以很容易地在颜色空间之间进行转换
下面列出了一些常见的色彩空间:
· RGB -> 许多图像最初都是使用这种格式编码的
· HSV -> 提供对颜色色调的更好控制
· 灰色 -> 使许多图像处理方法更准确
改变颜色空间的一些示例如下所示:
gray_img = cv2.cvtColor(rgb_img, cv2.COLOR_RGB2GRAY)
bgr_img = cv2.cvtColor(rgb_img, cv2.COLOR_RGB2BGR)
hsv_img = cv2.cvtColor(rgb_img, cv2.COLOR_RGB2HSV)

在 Python 中更改颜色空间。
图像模糊
当试图检测边缘(即描绘从一组像素到另一组像素的过渡的线条)时,模糊是一项重要的操作,因为它使对象边界之间的过渡更加平滑。例如,这可用于将对象与背景分离。
为这个项目研究了四个类别:
· 平均模糊 -> 快速但可能无法保留对象边缘
· 高斯模糊 -> 比平均模糊慢,但边缘保留得更好
· 中值过滤 -> 对异常值具有鲁棒性
· 双边过滤 -> 比上述方法慢得多。更多参数(更可调)。
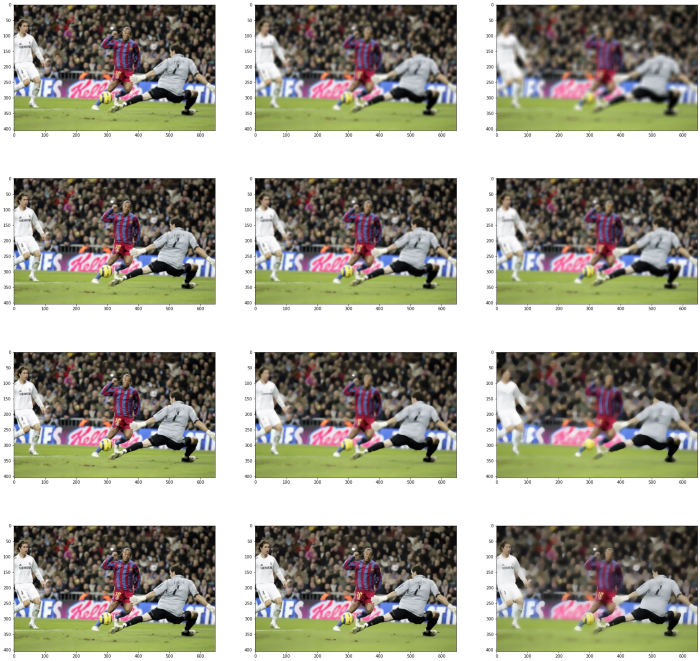
使用不同模糊方法的效果如下图所示。
第一行图显示了使用平均模糊同时从左到右增加内核大小的效果。
第二行图显示了使用高斯模糊同时从左到右增加内核大小的效果。
第三行图显示了使用中值模糊同时从左到右增加内核大小的效果。
第四行图显示了使用双边模糊同时从左到右增加sigmaSpace、diameter和sigmaColor参数的效果。
params = [(3, 20, 5, 5), (9, 20, 40, 20), (15, 20, 160, 60)]
fig,axs = plt.subplots(4, 3, figsize=(30,30))
i = 0
for (k, diameter, sigmaColor, sigmaSpace) in params:
simpleblur_image = cv2.blur(rgb_img, (k,k))
gaussblur_image = cv2.GaussianBlur(rgb_img, (k,k), 0)
medianblur_image = cv2.medianBlur(rgb_img, k)
bilateralblur_image = cv2.bilateralFilter(rgb_img, diameter, sigmaColor, sigmaSpace)
axs[0,i].imshow(simpleblur_image)
axs[1,i].imshow(gaussblur_image)
axs[2,i].imshow(medianblur_image)
axs[3,i].imshow(bilateralblur_image)
i+=1
#Plot results
plt.show()
检测图像中的边缘
边缘检测是一种识别图像内对象边界(即边缘)的图像处理技术。边缘使我们能够识别图像的底层结构,使它们成为我们需要从图像中获取的最重要信息之一。
下面使用 Canny 算法来检测图像上的边缘。
#cv2.Canny(image, minVal, maxVal)
img_gray = cv2.cvtColor(rgb_img, cv2.COLOR_RGB2GRAY)
thresholds = [(5,150), (100,150), (200,225)]
fig,axs = plt.subplots(1,4, figsize=(30,15))
i = 0
axs[i].imshow(rgb_img)
for (minVal, maxVal) in thresholds:
edge_img = cv2.Canny(img_gray, minVal, maxVal, apertureSize = 3, L2gradient = False)
axs[i+1].imshow(edge_img)
i += 1
plt.show()

在 Python 中使用 Canny 进行边缘检测。
掩盖图像中的颜色(应用蒙版)
通常,人们可能只想在图像中显示特定的颜色。这可以通过蒙版来实现。
OpenCV 中的inRange功能允许在 HSV 空间中完成此操作。
下面显示的图像(从左到右)分别是未应用蒙版、蒙版绿色、红色和蓝色的结果。
#Remove green background/field from image prior to clustering
green = np.array([60,255,255]) #This is green in HSV
loGreen = np.array([30,25,25]) #low green threshold
hiGreen = np.array([90,255,255]) #Upper green threshold
loBlue = np.array([0,25,25]) #low red threshold
hiBlue = np.array([30,255,255]) #Upper red threshold
loRed = np.array([120,25,25]) #low blue threshold
hiRed = np.array([180,255,255]) #Upper blue threshold
#Convert image to HSV
hsv = cv2.cvtColor(rgb_img, cv2.COLOR_BGR2HSV)
gmask = cv2.inRange(hsv, loGreen, hiGreen)
rmask = cv2.inRange(hsv, loRed , hiRed)
bmask = cv2.inRange(hsv, loBlue , hiBlue)
gresult = rgb_img.copy()
bresult = rgb_img.copy()
rresult = rgb_img.copy()
gresult[gmask==255] = (255,255,255)
bresult[bmask==255] = (255,255,255)
rresult[rmask==255] = (255,255,255)

在 Python 中掩盖颜色。
选择图像中的感兴趣区域
选择 ROI 是另一种形式的裁剪。如果你不想处理太多图像,此处显示的方法是快速裁剪图像的好方法。
#Select ROI from image
imagedraw = cv2.selectROI('select',rgb_img)
cv2.waitKey(0)
cv2.destroyWindow('select')
#cropping the area of the image within the bounding box using imCrop() function
roi_image = rgb_img[int(imagedraw[1]):int(imagedraw[1]+imagedraw[3]),
int(imagedraw[0]):int(imagedraw[0]+imagedraw[2])]
fig,axs = plt.subplots(1,1, figsize=(5,5))
axs.imshow(roi_image)
plt.show()

ROI 图像。
从图像中提取颜色
在这一点上,已经介绍了许多基本的处理操作,这些操作应该足以从图像中确定球员球衣颜色。为了确定颜色,尝试了以下方法:
· 在单个像素处提取颜色
· 通过逐像素平均提取颜色
· 使用 K-Means 聚类获得图像中的 k-colors
在单个像素处提取颜色
通过将像素的 x,y 坐标提供给图像数组,读取该像素的 RGB 通道的结果,并将这些 RGB 通道分配到一个数组中,可以轻松地提取单个像素的颜色。
写了一个小函数来处理下图中的各种像素。下面显示了 17 个不同像素的结果。
#Get color from single pixel in image
#Make list of pixel coordinates based on image shape
y = range(0, height, 25)
x = range(0, width, 25)
#Combine lists above into a list of tuples
merged_list = tuple(zip(x, y))
#Initialize the plot
fig,axs = plt.subplots(1, len(y), figsize=(30,30))
i = 0
#Iterate over elements in tuple list of pixel coordinates
for (x, y) in merged_list:
#Return rgb tuple at x,y coordinate
r, g, b = (rgb_img[x, y])
# Creating rgb array from rgb tuple
color_of_pix = np.zeros((5, 5, 3), np.uint8)
color_of_pix[:] = [r, g, b]
#Display rgb array
axs[i].imshow(color_of_pix)
i += 1
plt.show()

提取像素颜色的方法1。
通过逐像素平均提取主色
现在我们可以提取单个像素的颜色,我们可以扩展该方法来确定图像的平均颜色。将 x, y 坐标传递给我们的图像数组会返回一个像素的 RGB 元组。
然后,通过在每个像素处添加元组中每个元素的值,我们可以获得与每个 RGB 通道相关的“总计数”。最后,我们可以将每个 RGB 颜色通道中的计数除以图像中的像素总数,以获得图像的平均颜色。
#Determining most frequently occurring color pixel by pixel
def most_common_used_color(img):
# Get width and height of Image
height, width, depth = img.shape
# Initialize Variable
r_total = 0
g_total = 0
b_total = 0
count = 0
# Iterate through each pixel
for x in range(0, height):
for y in range(0, width):
# r,g,b value of pixel
r, g, b = (img[x, y])
r_total += r
g_total += g
b_total += b
count += 1
return (r_total/count, g_total/count, b_total/count)
这个过程的结果如下所示,其中平均颜色变成了一个 HEX 值为#787561的灰绿色,通过对图像的视觉检查,这看起来是合理的。但是,我们可以改善这一点吗?
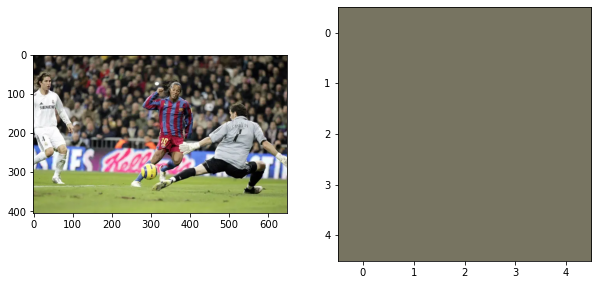
图像中最常见的用户颜色由平均确定。
通过 K-Means 聚类提取主色
K-Means 聚类算法可以进一步改进球员球衣颜色检测程序。该例程将允许我们通过指定例程应使用的簇数k来提取图像中的几种“主要颜色”。如果知道数据应该属于多少个集群,则可以先验地确定k的值。
否则,确定k值的常用方法是通过肘部法,如下所示。图表的拐点(又名肘部)是应该使用的 k 值。
肘部图的结果表明,最佳 k 值为3.
#Determine optimal k value for clustering using elbow method
distortions = [] #Initialize array with distortions from each clustering run
K = range(1,11) #Explore k values between 1 and 10
#Run the clustering routine
for k in K:
#Convert image into a 1D array
flat_img = np.reshape(rgb_img,(-1,3))
kmeanModel = KMeans(n_clusters=k)
kmeanModel.fit(flat_img)
distortions.append(kmeanModel.inertia_)
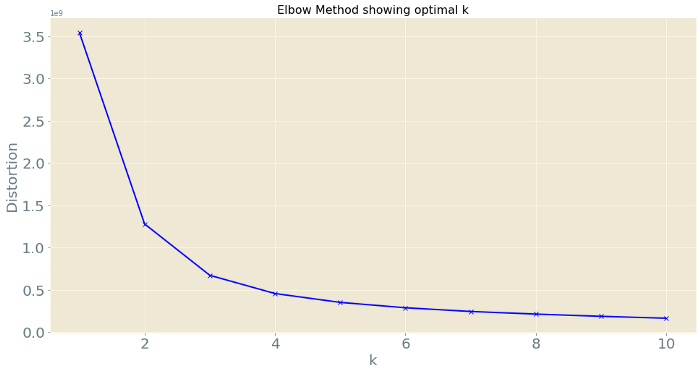
进行肘部法的结果。
在图像上运行 k-means 聚类
确定k应该是3后,可以编写一个小程序来拍摄图像并确定其 k 主导颜色。
k = 3、k = 4和k = 10(只是为了搞笑而取的4和10)案例的结果如下所示:
def KMeansTest(img,clusters):
"""
Args:
path2img : (str) path to cropped player bounding box
clusters : (int) how many clusters to use for KMEANS
Returns:
rgb_array : (tuple) Dominant colors in image in RGB format
"""
org_img = img.copy()
#print('Org image shape --> ',img.shape)
#Convert image into a 1D array
flat_img = np.reshape(img,(-1,3))
arrayLen = flat_img.shape
#Do the clustering
kmeans = KMeans(n_clusters = clusters, random_state=0, tol = 1e-4)
kmeans.fit(flat_img)
#Define the array with centroids
dominant_colors = np.array(kmeans.cluster_centers_,dtype='uint')
#Calculate percentages
percentages = (np.unique(kmeans.labels_,return_counts=True)[1])/flat_img.shape[0]
#Combine centroids representing dominant colors and percentages associated with each centroid into an array
pc = list(zip(percentages,dominant_colors))
pc = sorted(pc,reverse=True)
i = 0
rgb_array = []
for i in range(clusters):
dummy_array = pc[i][1]
rgb_array.append(dummy_array)
i += 1
return rgb_array
#Call K-Means function with K = 3
nClusters = 3
rgb_array = KMeansTest(rgb_img, nClusters)
plotKMeansResult(nClusters,rgb_array)

从 K-Means 聚类确定的图像中的前三种颜色。图像中的色彩流行度从左到右递减。
使用k=3确定的顶部颜色是绿色,在目视检查时,考虑到“绿色区域”的普遍存在,它看起来是正确的。
#Call K-Means function with K = 4
nClusters = 4
rgb_array = KMeansTest(rgb_img, nClusters)
plotKMeansResult(nClusters,rgb_array)

从 K-Means 聚类确定的图像中的前四种颜色。图像中的色彩流行度从左到右递减。
使用k=4确定的顶部颜色也是绿色。然而,它是一个更明亮的阴影。
#Call K-Means function with K = 10
nClusters = 10
rgb_array = KMeansTest(rgb_img, nClusters)
plotKMeansResult(nClusters,rgb_array)

从 K-Means 聚类确定的图像中的前 10 种颜色。图像中的色彩流行度从左到右递减。
使用k=10确定的顶部颜色也是绿色。但是,它比前两个示例要亮得多。从k=10的使用可以看出,可以通过使用更多的簇来获得更高的颜色特异性。
要点是 k-means 例程可以准确地检测颜色并提供图像中最常出现的颜色。
识别图像中的人
在开始处理视频片段之前,还对另一件事感兴趣。想检查图像中球员/人的分类和/或识别。这些对象的分类不是作业的一部分,但想简要探讨一下以满足我的好奇心。
OpenCV 中的 HOG 包包含训练模型的数据库,这些模型能够检测不同的对象,如猫、脸和人类。在以后的文章中,将展示为解决这个分类问题而构建的神经网络模型。但现在,将展示 HOG 包的用法。
#Detecting humans with HOG
path2xml = r'C:UsersmurcDocumentsGitHubopencvdatahaarcascadeshaarcascade_fullbody.xml'
fbCascade = cv2.CascadeClassifier(path2xml)
# Initializing the HOG person detector
image = cv2.cvtColor(rgb_img, cv2.COLOR_RGB2GRAY)
hog = cv2.HOGDescriptor()
hog.setSVMDetector(cv2.HOGDescriptor_getDefaultPeopleDetector())
# Resizing the Image
image = imutils.resize(image, width = min(1000, image.shape[1]))
# Detecting all the regions in the image that has a person inside it
#(regions, _) = hog.detectMultiScale(image, winStride = (2,2), padding = (4, 4), scale = 1.1)
players = fbCascade.detectMultiScale(image, scaleFactor = 1.005, minSize=(20, 20), minNeighbors = 1)
image2 = rgb_img.copy()
# Drawing the regions in the Image
i=0
for (x, y, w, h) in players:
cv2.rectangle(image2, (x, y), (x + w, y + h), (0, 255, 0), 3)
currentbox = image2[y:y+h,x:x+w]
i+=1

在 Python 中使用 HOG 包检测图像中的球员失败。
花了一些时间研究检测器的参数,并没有得到更好的结果。尝试使用DefaultPeopleDetector和Haar 级联分类器haarcascade_fullbody,但无法得到想要的结果。
尽管检测球员本身不是项目的一部分(得到了一个包含球员边界框坐标的 JSON 文件),但仍然想确保成功使用 HOG 检测器。
在下面尝试了一个不同的图像,认为它可以让我成功检测。在尝试了几分钟的参数后,我找到了一个有效的组合!决定仅使用球员边界框 (BB) 生成图像,并将 K-means 例程应用于该 BB 的内容。结果如下所示:
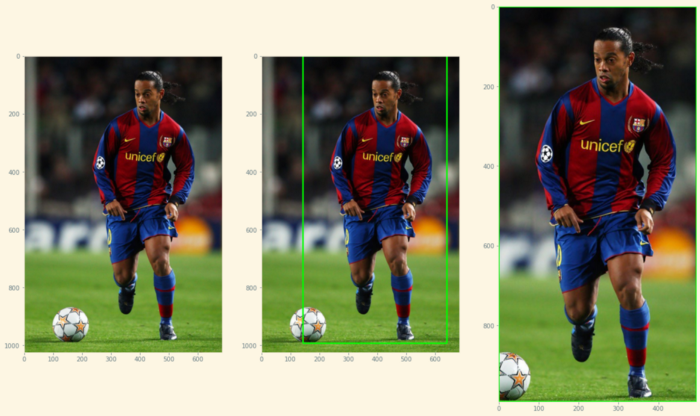
使用 HOG 包检测球员并提取包含球员的边界框。

上图中的前 4 种颜色是通过 K-Means 聚类确定的。
需要研究优化/自动化对象检测器功能的参数,但对到目前为止的进展感到满意。
处理视频和提取帧
在熟悉了各种图像处理和处理技术并了解如何实施 K-Means 以提取图像中的主色后,我决定开始处理视频片段,因为我确信我有开发的基础,可以从图像中确定球衣颜色。
部分文件涉及从两个不同的摄像机拍摄的足球比赛的视频片段。需要做的第一件事是获取视频文件,使用以下代码:
def getListOfFiles(rPath , fType):
"""
Args:
rPath: (str) path to file
fType: (str) type of file to look for (i.e., .mp4, .json, etc.)
Returns:
lFiles: (list) List of files in rPath of type fType
"""
#1. Establish the current working directory
directory = os.getcwd()
#2. List all files in rPath of type fType
lFiles = glob.glob(directory + rPath + "*" + fType)
return lFiles
现在有了 mp4 文件的列表,可以从视频中提取单个帧:
def get_frame(video_file, frame_index):
"""
Args:
video_file: (str) path to .MP4 video file
frame_index: (int) query frame index
Returns:
frame: (ndarray, size (y, x, 3)) video frame
Uses OpenCV BGR channels
"""
video_capture = cv2.VideoCapture(video_file)
video_capture.set(cv2.CAP_PROP_POS_FRAMES, frame_index)
success, frame = video_capture.read()
if not success:
raise ValueError(
"Couldn't retrieve frame {0} from video {1}".format(
frame_index,
video_file
)
)
return frame
现在可以可视化从两个相机中提取的帧。帧 2500 如下所示:

分别从左右相机中提取帧。
想从视频中提取的另一件事是其中的帧数。这可以使用以下代码来完成:
#Determine number of frames in video
def count_frames(video_file):
"""
Args:
video_file: (str) path to .MP4 video file
Returns:
nFrames: (int) Number of frames in mp4
"""
cap = cv2.VideoCapture(video_file)
length = int(cap.get(cv2.CAP_PROP_FRAME_COUNT))
return(length)
加载 JSON 文件并检查边界框
JSON 文件包含球员边界框坐标。需要做的第一件事是加载 JSON 文件。
JSON 文件与 MP4 文件相关联,因此必须确保在批处理所有文件时,正确的 JSON 文件与正确的 MP4 文件配对。
为此,将首先从之前生成的文件名列表中删除路径和.json扩展名,并将结果放入名为json_strip的列表中。
然后,将从先前生成的每个相机(LCAMERA和RCAMERA)的MP4文件列表中删除路径,并将结果分别放入两个名为MP4_strip_LC和MP4_strap_RC的列表中。
最后,将使用这些列表从每台摄像机中获取与这些文件相关联的索引。完成上述步骤的例程如下所示:
def matchJSON2MP4(jsonList, jsonPath, MP4list, MP4Path, whichMP4):
json_strip = [s.replace(directory + jsonPath + '\', '') for s in jsonList]
json_strip = [s.replace(".json", '') for s in json_strip]
mp4_strip = [s.replace(directory + MP4Path + '\', '') for s in MP4list]
mp4Name = mp4_strip[whichMP4]
index = json_strip.index(mp4Name)
print(index)
return index
可以读取 JSON 文件并使用上面的框架获取绑定框信息。为此,将为正在处理的视频中的每个帧生成一个字典,其中包含每个球员边界框(检测)的坐标。
#Get dictionary from json file
def read_json_dict(path2json):
"""
Args:
path2json: (str) path to .MP4 json file containing player bounding boxes
Returns:
bb_dict: (dict) Dictionary containing bounding boxes in each frame
"""
# Opening JSON file
f = open(path2json)
# Returns JSON object as a dictionary
bb_dict = json.load(f)
f.close()
return(bb_dict)
上面的代码为提供了当前视频中每一帧的边界框。
接下来,将确定给定帧中有多少个边界框。
#Determine number of bounding boxes in frame
def count_bboxes(bb_dict,frame_index):
"""
Args:
bb_dict: (dict) dictionary from json file
frame: (int) what frame is being processed
Returns:
nDetections: (int) Number of bounding boxes in frame
"""
bbs = bb_dict['frames'][frame_index]['detections']
nDetections = len(bbs)
#print(nDetections, " bounding boxes found in frame ", frame_index)
return(nDetections)
接下来,将确定视频中包含球员检测的第一帧。
#Find first frame that contains detections
def findFirstFrame(bb_dict):
"""
Args:
bb_dict: (dict) dictionary from json file
Returns:
firstFrame: (int) First frame to process in video
"""
firstFrame = bb_dict['frames'][0]['frame_index']
print('These is the first frame to process in video ', firstFrame)
return(firstFrame)
接下来,对不同视频可能不同的frame_index值进行检测。让我们根据 JSON 文件计算出视频的检测收集间隔。
#Find first frame that contains detections
def findFrameSpacing(bb_dict):
"""
Args:
bb_dict: (dict) dictionary from json file
Returns:
spacing: (int) Spacing between frames in json
"""
frame0 = bb_dict['frames'][0]['frame_index']
frame1 = bb_dict['frames'][1]['frame_index']
spacing = abs(frame1 - frame0)
print('The frame spacing is ', spacing)
return(spacing)
接下来,将从 JSON 文件中提取当前帧的所有边界框坐标。
#Extract bounding boxes for a given frame from json
def get_bb4frame(bb_dict,frame_index):
"""
Args:
bb_dict: (dict) dictionary from json file
frame: (int) what frame is being processed
Returns:
nDetections: (int) Number of bounding boxes in frame
"""
bbs = bb_dict['frames'][frame_index]['detections']
#print('These are the coordinates for all bounding boxes in frame', frame_index)
#print(bbs)
return(bbs)
最后,将从 JSON 文件中提取特定边界框的边界框坐标。
#Extract bounding box coordinates for a specific bounding box in current frame from json
def makeRectangleFromJSON(bb_dict,whichBB):
"""
Args:
bb_dict: (dict) dictionary from json file
whichBB: (int) what bounding box is being processed
Returns:
x1 ,y1 ,x2 ,y2: (tuple) tuple containing pixel coordinates for the upper-left and lower-right corners of the bounding box
"""
x1 ,y1 ,x2 ,y2 = bb_dict[whichBB][0],bb_dict[whichBB][1],bb_dict[whichBB][2],bb_dict[whichBB][3]
#print(x1 ,y1 ,x2 ,y2, ' These are the coordinates for bounding box ', whichBB)
return(x1 ,y1 ,x2 ,y2)
让我们通过可视化边界框来看看我的例程是否有效!
这是视频中第一帧的示例,其中分别包含对左右摄像头的检测。第一帧分别被确定为第 0 帧和第 62 帧。

来自左右摄像机的视频素材的原始第一帧。
绘制了球员边界框的帧如下所示。

来自带有播放器边界框的左右摄像机的视频片段的帧。
最后,这是帧中每个球员的边界框。

来自左侧摄像头的球员边界框。

来自右侧摄像机的球员边界框。
到目前为止的方法允许我成功地提取球员边界框。从一些边界框可以看出一些东西。
首先,存在误报的情况。此数据中的误报意味着没有球员的边界框。这是未来需要解决的问题。
应用 K-Means 聚类确定球员球衣颜色
现在数据形状正确。现在,让我们尝试在边界框上应用 K-Means 聚类例程,看看会发生什么。将坚持处理到目前为止我一直在使用的相同视频和帧,以便可以专注于聚类本身。
聚类例程如下所示。该例程需要以下步骤:
1. 将图像(球员边界框)转换为 HSV 颜色空间
2. 将图像展平为一维阵列,以便于处理
3. 运行 K 均值聚类
4. 确定图像上每种颜色的百分比
5. 按降序对这些颜色进行排序并将它们放入一个数组中
def KMeansImage(img, clusters):
"""
Args:
path2img : (str) path to cropped player bounding box
clusters : (int) how many clusters to use for KMEANS
Returns:
rgb_array : (tuple) Dominant colors in image in RGB format
"""
org_img = img.copy()
#Convert image to HSV
hsv = cv2.cvtColor(img, cv2.COLOR_BGR2HSV)
#Convert image into a 1D array
flat_img = np.reshape(hsv,(-1,3))
arrayLen = flat_img.shape
rgb_array = []
#Do the clustering
kmeans = KMeans(n_clusters = clusters, random_state=0, tol = 1e-4)
kmeans.fit(flat_img)
#Define the array with centroids
dominant_colors = np.array(kmeans.cluster_centers_,dtype='uint')
#Calculate percentages
percentages = (np.unique(kmeans.labels_,return_counts=True)[1])/flat_img.shape[0]
#Combine centroids representing dominant colors and percentages
#associated with each centroid into an array
pc = list(zip(percentages,dominant_colors))
pc = sorted(reversed(pc), reverse = True, key = lambda x: x[0])
i = 0
for i in range(clusters):
#dummy_array = pc[i][1]
rgb_array.append(pc[i][1])
i += 1
return rgb_array
在前四个边界框上运行此例程的结果如下所示:
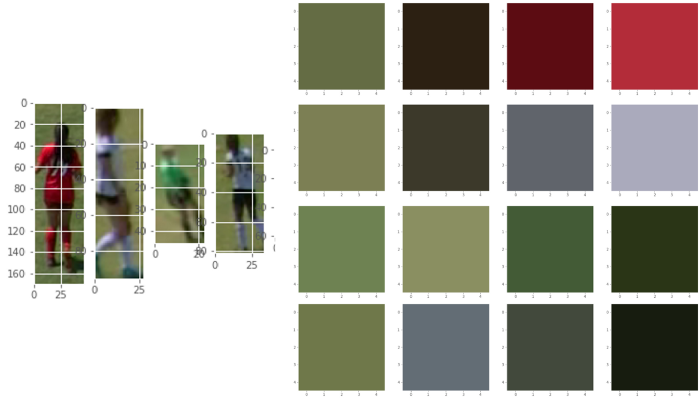
显示的边界框上的聚类结果。
上述结果的主要内容之一是绿色是所有边界框中的主要颜色。
绿色色调主要来自田野中存在的草。这就是蒙版将发挥作用的地方。
将蒙版应用于图像数据
为了更好地处理边界框中草场的存在,将使用蒙版。包括为构成 HSV 颜色空间的三个值(即色调、饱和度、亮度)中的每一个设置低阈值和高阈值。如果一种颜色落在此阈值的范围内,那么它将被屏蔽掉。
此外,添加了一些错误处理,用于蒙版过程删除了太多像素的情况。聚类例程要求要处理的图像至少具有与聚类一样多的唯一像素。因此,如果生成的蒙版图像的尺寸低于所需的簇数,则该图像将被忽略。这种情况很可能发生在边界框只有一个字段的情况下。
def KMeansMaskGreen(img, clusters, lowHue, highHue, lowSat, highSat, loBright, hiBright):
"""
Args:
path2img : (str) path to cropped player bounding box
clusters : (int) how many clusters to use for KMEANS
Returns:
rgb_array : (tuple) Dominant colors in image in RGB format
"""
org_img = img.copy()
#print('Org image shape --> ',img.shape)
green = np.array([60,25,25])
loGreen = np.array([lowHue, lowSat, loBright]) #low green threshold
hiGreen = np.array([highHue, highSat, hiBright]) #Upper green threshold
#Convert image to HSV
hsv = cv2.cvtColor(img, cv2.COLOR_BGR2HSV)
#Make the mask
mask = cv2.inRange(hsv, loGreen, hiGreen)
mask_img = img.copy()
mask_img[mask==255] = (255,255,255)
#Remove white pixels from image so that they don't interfere with the process
mask_img = mask_img[np.all(mask_img != 255 , axis=-1)]
#Convert image into a 1D array
flat_img = np.reshape(mask_img,(-1,3))
arrayLen = flat_img.shape
#Ensure that masking didn't remove everything (Generally happens in false positives)
if mask_img.shape[0] <= clusters:
#print('Cropped image has dimensions lower than number of desired clusters.Not clustering current image')
rgb_array = np.empty((clusters,3,))
rgb_array[:] = np.nan
return rgb_array
else:
rgb_array = []
#Do the clustering
kmeans = KMeans(n_clusters = clusters, random_state=0, tol = 1e-4)
kmeans.fit(flat_img)
#Define the array with centroids
dominant_colors = np.array(kmeans.cluster_centers_,dtype='uint')
#Calculate percentages
percentages = (np.unique(kmeans.labels_,return_counts=True)[1])/flat_img.shape[0]
#Combine centroids representing dominant colors and percentages
#associated with each centroid into an array
pc = list(zip(percentages,dominant_colors))
pc = sorted(reversed(pc), reverse = True, key = lambda x: x[0])
i = 0
for i in range(clusters):
#dummy_array = pc[i][1]
rgb_array.append(pc[i][1])
i += 1
return rgb_array
下面显示了几种不同情况下使用蒙版的结果。使用蒙版去除绿色对改进颜色检测程序有很大帮助!
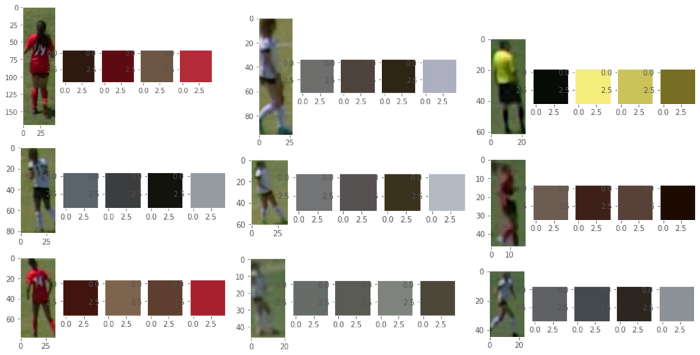
应用绿色蒙版后球员边界框中的主要颜色。
移除边界框的下半部分以专注于球衣数据
由于任务是仅确定球衣颜色,因此裁剪图像的底部也有助于加强分析,因为我们可以专注于更重要的区域并提高球员球衣颜色检测的准确性。这可以通过下面的代码段简单地完成。
def crop_image(image,howMuch):
"""
Args:
img : (array) image of player bounding box
howMuch : (int) percent of image to crop (between 0 and 100)
Returns:
cropped_img : (array) cropped image
"""
val = howMuch/100
cropped_img = image[0:int(image.shape[0]*val),0:int(image.shape[0])]
return cropped_img
应用蒙版和裁剪后的聚类例程的结果如下所示:

蒙版字段和裁剪图像底部后的主要颜色。
处理整个 MP4 文件
让我们尝试处理每一帧,看看会发生什么!
到目前为止,已经完成了所有例程并将它们放入下面的包装函数中。
此包装函数将 JSON 文件的路径、mp4 文件的路径、要处理的视频以及 k-means 的聚类数作为输入。
此函数的输出是一个 pandas 数据帧,其中包含当前视频每帧中每个边界框的 RGB 格式的主色。
def getJerseyColorsFromMP4(jsonPath,MP4Path,whichVideo,nClusters):
#Make the list of mp4 and json files from each camera
print('Retrieving MP4 and JSON files...')
mp4List = getListOfFiles(MP4Path , ".mp4")
jsonList = getListOfFiles(jsonPath , ".json")
#Find the json file to use for the current video
jval = matchJSON2MP4(jsonList, jsonPath, mp4List, MP4Path, whichVideo)
#Get json dictionary of all bounding boxes in video
bb_dict = read_json_dict(jsonList[jval])#This is for first video in the LCamera folder
#Find first frame with detections
firstFrame = findFirstFrame(bb_dict)
#Determine frame spacing
frameSpacing = findFrameSpacing(bb_dict)
#Which frame to look at
whichFrame = 0
whichFrameAdj = firstFrame + whichFrame*frameSpacing #Adjust for video data to match json detection
nf = int(count_frames(mp4List[whichVideo])/10) #Number of frames in video
print('Initializing arrays...')
#Initialize arrays
dom_color1, dom_color2,dom_color3 = [],[],[]
frame_list,bb_list,video_list = [],[],[]
#Insert loop here for frames
print('Starting jersey color detection ...')
while whichFrameAdj < nf:
for i in tqdm(range(nf), desc="Processing Frame"):#Add progress bar for frames processed
#Get a frame from video
frame = get_frame(mp4List[whichVideo], whichFrameAdj)
#Convert color from BGR to RGB
frame = cv2.cvtColor(frame, cv2.COLOR_BGR2RGB)
#Make a copy of the frame to store for display of all the bounding boxes
frame_copy = frame.copy()
#Determine number of bounding boxes in current frame
n_bbs = count_bboxes(bb_dict,whichFrame)
#Get BB coordinates for current frame
bbs_frame = get_bb4frame(bb_dict,whichFrame) #BB coordinates for current frame
#Loop over bounding boxes in current frame
for bb in range(n_bbs):
#print('****Frame ' + str(whichFrameAdj) + ' BB ' + str(bb) + '****')
frame_list.append(whichFrameAdj) #Append frame ID to list
bb_list.append(bb)
video_list.append(whichVideo)
x1 ,y1 ,x2 ,y2 = makeRectangleFromJSON(bbs_frame,bb) #Coordinates for current BB
currentbox = frame[y1:y2,x1:x2]
cv2.rectangle(frame_copy, (x1, y1), (x2, y2), (0, 0, 255), 2)
#Crop the bounding box
croped_bb = crop_image(currentbox,howMuch)
#Do the clustering
rgb_array = KMeansMaskGreen(croped_bb, nClusters,
lowHue, highHue, lowSat, highSat, loBright, hiBright)
#Append dominant RGB colors into respective arrays
dom_color1.append(rgb_array[0])
dom_color2.append(rgb_array[1])
dom_color3.append(rgb_array[2])
whichFrame += 1
whichFrameAdj = firstFrame + whichFrame*frameSpacing #Adjust for video data to match json
print('Making pandas dataframe containing results...')
jerseyColor_df = pd.DataFrame({'Video ID': video_list,
'Frame ID': frame_list,
'BB in Frame': bb_list,
'Jersey Color 1': dom_color1,
'Jersey Color 2': dom_color2,
'Jersey Color 3': dom_color3})
print('PROCESS COMPLETED')
return jerseyColor_df
10 分钟内可处理 723 帧。平均帧处理速率为 1.23 帧/秒。这个速率取决于给定帧处理了多少边界框。让我们看一下我制作的数据框。
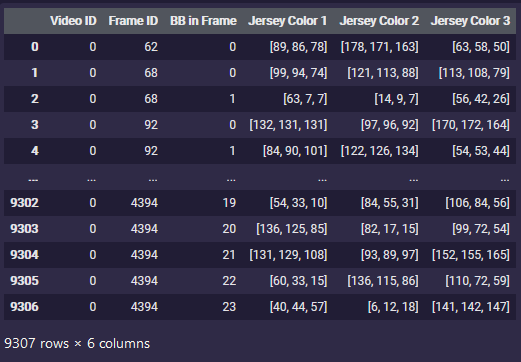
包含视频聚类结果的 Pandas 数据帧。
数据框具有所需的结构。可以看出,总共处理了 9,307 个边界框。这意味着每秒可以处理 15.8 个边界框。将删除数据框中包含 NaN 数组的所有行(这些是包含误报的数组)。
到目前为止处理的数据集中有281个误报,这意味着球员对象的分类过程有97%的准确率,相当不错!现在将尝试使用我们数据帧中 RGB 列上的 K-Means 例程查看当前处理的 MP4 帧中的前五种颜色。
所有已处理的边界框中最常见的颜色是什么?
认为在处理后的 MP4 文件中查看最常出现的颜色会很有趣。这个过程可以帮助识别与视频片段中出现的球队相关的球衣颜色,然后可以用来开发能够区分不同球队球员的算法程序。
由于有一个 pandas 数据框,其中包含每个边界框中出现的最多、第二和第三主要颜色,因此我可以利用与之前介绍的聚类例程类似的聚类例程,从这些类别中的每一个中获取最主要的颜色。此过程的结果如下所示:

目前所有球员边界框中最常见的颜色。
如上图所示,深灰色对应于总颜色的 29.32%,栗红色对应于所有边界框中的颜色的 27.60%。处理后的视频中的球队球衣是红色和白色的。
由于阴影和照明的差异,这里观察到的前两种颜色准确地描绘了球队球衣,随后可以用于球队分类。
处理整个比赛
在下面显示的例程已在单个 MP4 文件上进行了演示。然而,这个 MP4 文件对应于几分钟比赛时间的镜头。
话虽如此,将代码例程开发得相当模块化,因此,它可以通过以下例程连接从每个 MP4 文件获得的结果来轻松地用于处理整个比赛过程:
def getJerseyColorsFromGame(jsonPath,MP4Path,whichVideo,nClusters):
mp4_list = getListOfFiles(MP4Path , ".mp4")
n_mp4 = len(mp4_list)
df_list = []
for vid in range(n_mp4):
jerseyColor_df = getJerseyColorsFromMP4(jsonPath,MP4Path,vid,nClusters)
df_list.append(jerseyColor_df)
allJerseyColors = pd.concat(df_list)
return allJerseyColors
用于快速可视化聚类结果的 GUI
pandas 数据框整齐地存储了聚类结果。然而,所有这些数字可能有点难以理解。因此,我编写了一个 GUI,该 GUI 将使用轨迹栏在我的 pandas 数据框的行中移动,并沿着三种最主要的颜色绘制裁剪的球员边界框。它将根据聚类算法确定它们的十六进制代码。
下面显示了此代码以及运行中的 GUI 演示。
#Make image bigger
def makeBigger(img):
dim = (300, 200) #(width, height)
# resize image
resized = cv2.resize(img, dim, interpolation = cv2.INTER_AREA)
return resized
# empty function called when trackbar moves
def emptyFunction():
pass
#Panel to cycle through player bounding boxes and 2 dominant colors in each BB
def main(df):
# blackwindow having 3 color chanels
windowName ="Open CV Color Palette"
# window name
cv2.namedWindow(windowName)
# Define trackbar
rows = df.shape[0]-1
cv2.createTrackbar('BB ID', windowName, 0, rows, emptyFunction)
#previousTrackbarValue = -1 # Set this to -1 so the threshold will be applied and the image displayed the first time through the loop
# Used to open the window until press ESC key
while(True):
if cv2.waitKey(1) == 27:
break
# Which row to look at in dataframe?
bbID = cv2.getTrackbarPos('BB ID', windowName)
print(bbID)
fName = df.iloc[bbID]['File Name']
print(fName)
bb = cv2.imread(fName)
bb = makeBigger(bb)
bbsize = bb.shape
image1 = np.zeros((bbsize[0], bbsize[1], 3), np.uint8)
image2 = np.zeros((bbsize[0], bbsize[1], 3), np.uint8)
image3 = np.zeros((bbsize[0], bbsize[1], 3), np.uint8)
# values of blue, green, red extracted from the dataframe
hex_string1 = df.iloc[bbID]['Jersey Color 1']
hex_string2 = df.iloc[bbID]['Jersey Color 2']
hex_string3 = df.iloc[bbID]['Jersey Color 3']
rgb1 = hex_to_rgb(hex_string1)
blue1 = rgb1[2]
green1 = rgb1[1]
red1 = rgb1[0]
rgb2 = hex_to_rgb(hex_string2)
blue2 = rgb2[2]
green2 = rgb2[1]
red2 = rgb2[0]
rgb3 = hex_to_rgb(hex_string3)
blue3 = rgb3[2]
green3 = rgb3[1]
red3 = rgb3[0]
# font
font = cv2.FONT_HERSHEY_SIMPLEX
# org
org = (75, 50)
# fontScale
fontScale = 1
# Blue color in BGR
color = (255, 0, 0)
# Line thickness of 2 px
thickness = 2
image1[:] = [blue1, green1, red1]
image2[:] = [blue2, green2, red2]
image3[:] = [blue3, green3, red3]
# Using cv2.putText() method
image1 = cv2.putText(image1, hex_string1, org, font, fontScale, color, thickness, cv2.LINE_AA)
image2 = cv2.putText(image2, hex_string2, org, font, fontScale, color, thickness, cv2.LINE_AA)
image3 = cv2.putText(image3, hex_string3, org, font, fontScale, color, thickness, cv2.LINE_AA)
# concatenate image Vertically
verti = np.concatenate((bb, image1, image2, image3), axis=0)
cv2.imshow(windowName, verti)
cv2.destroyAllWindows()
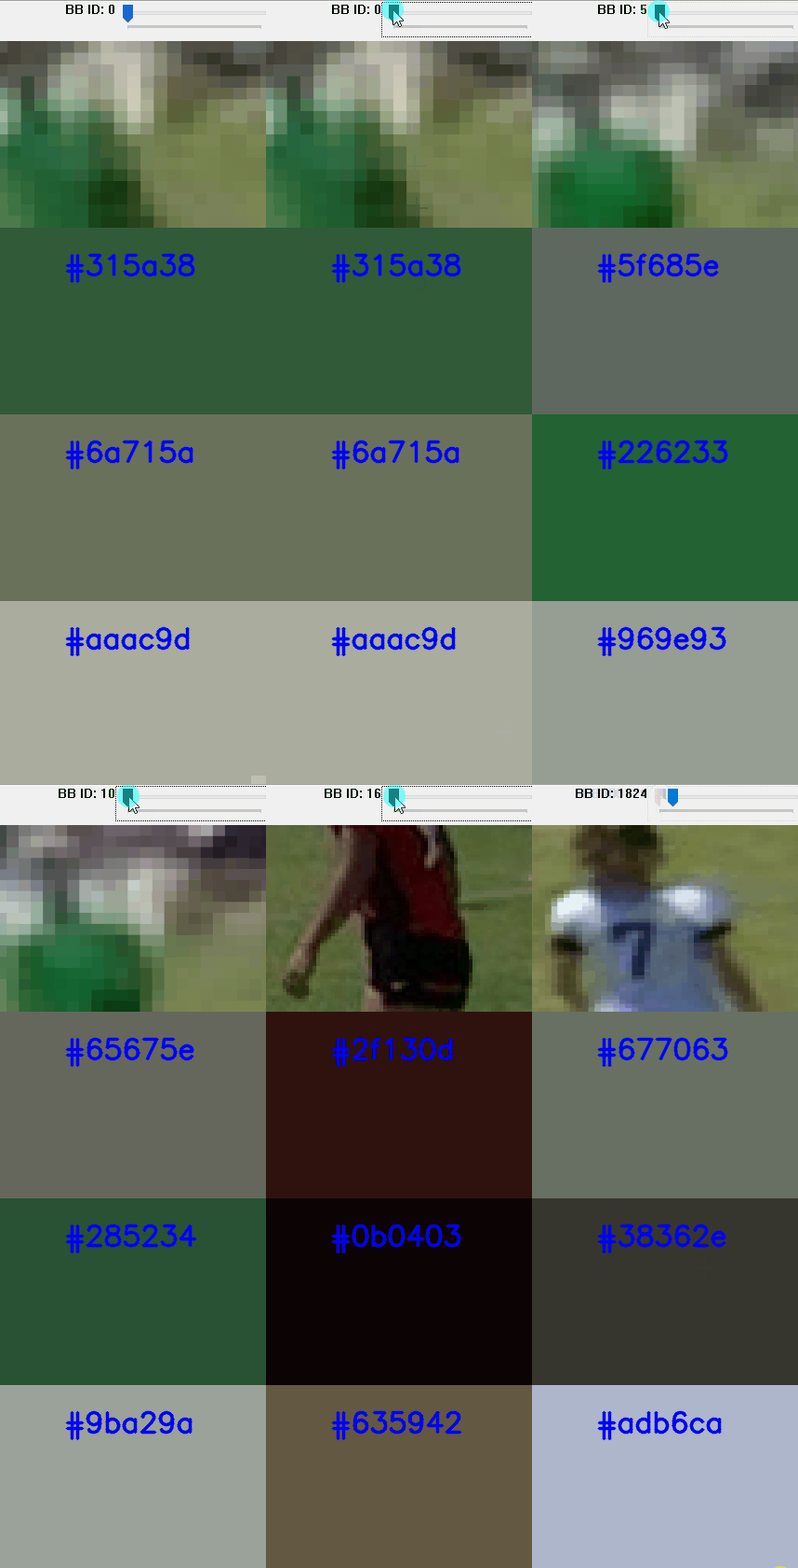
展示聚类结果的 GUI 演示。
结论
上面显示的工作演示了如何使用 K-Means 聚类算法从足球比赛视频片段中提取球衣颜色。在这个过程中,某些方面还有待改进。例如,可以尝试通过视频的多处理或批处理来提高代码效率。
此外,可以通过在处理误报(即裁判、非球员对象)时包含更好的错误处理来改进例程。聚类过程结果与预期输出一致(即,主要颜色是红色和白色,而球队球衣颜色是红色和白色)。
原文标题 : 使用 Python 从视频片段中确定足球球员球衣的颜色


